Platform · Storage Analytics
What a battery earns in Spain, every day.
A free public dashboard with real electricity market data. We built it for our own studies and opened it up so anyone can check the numbers.
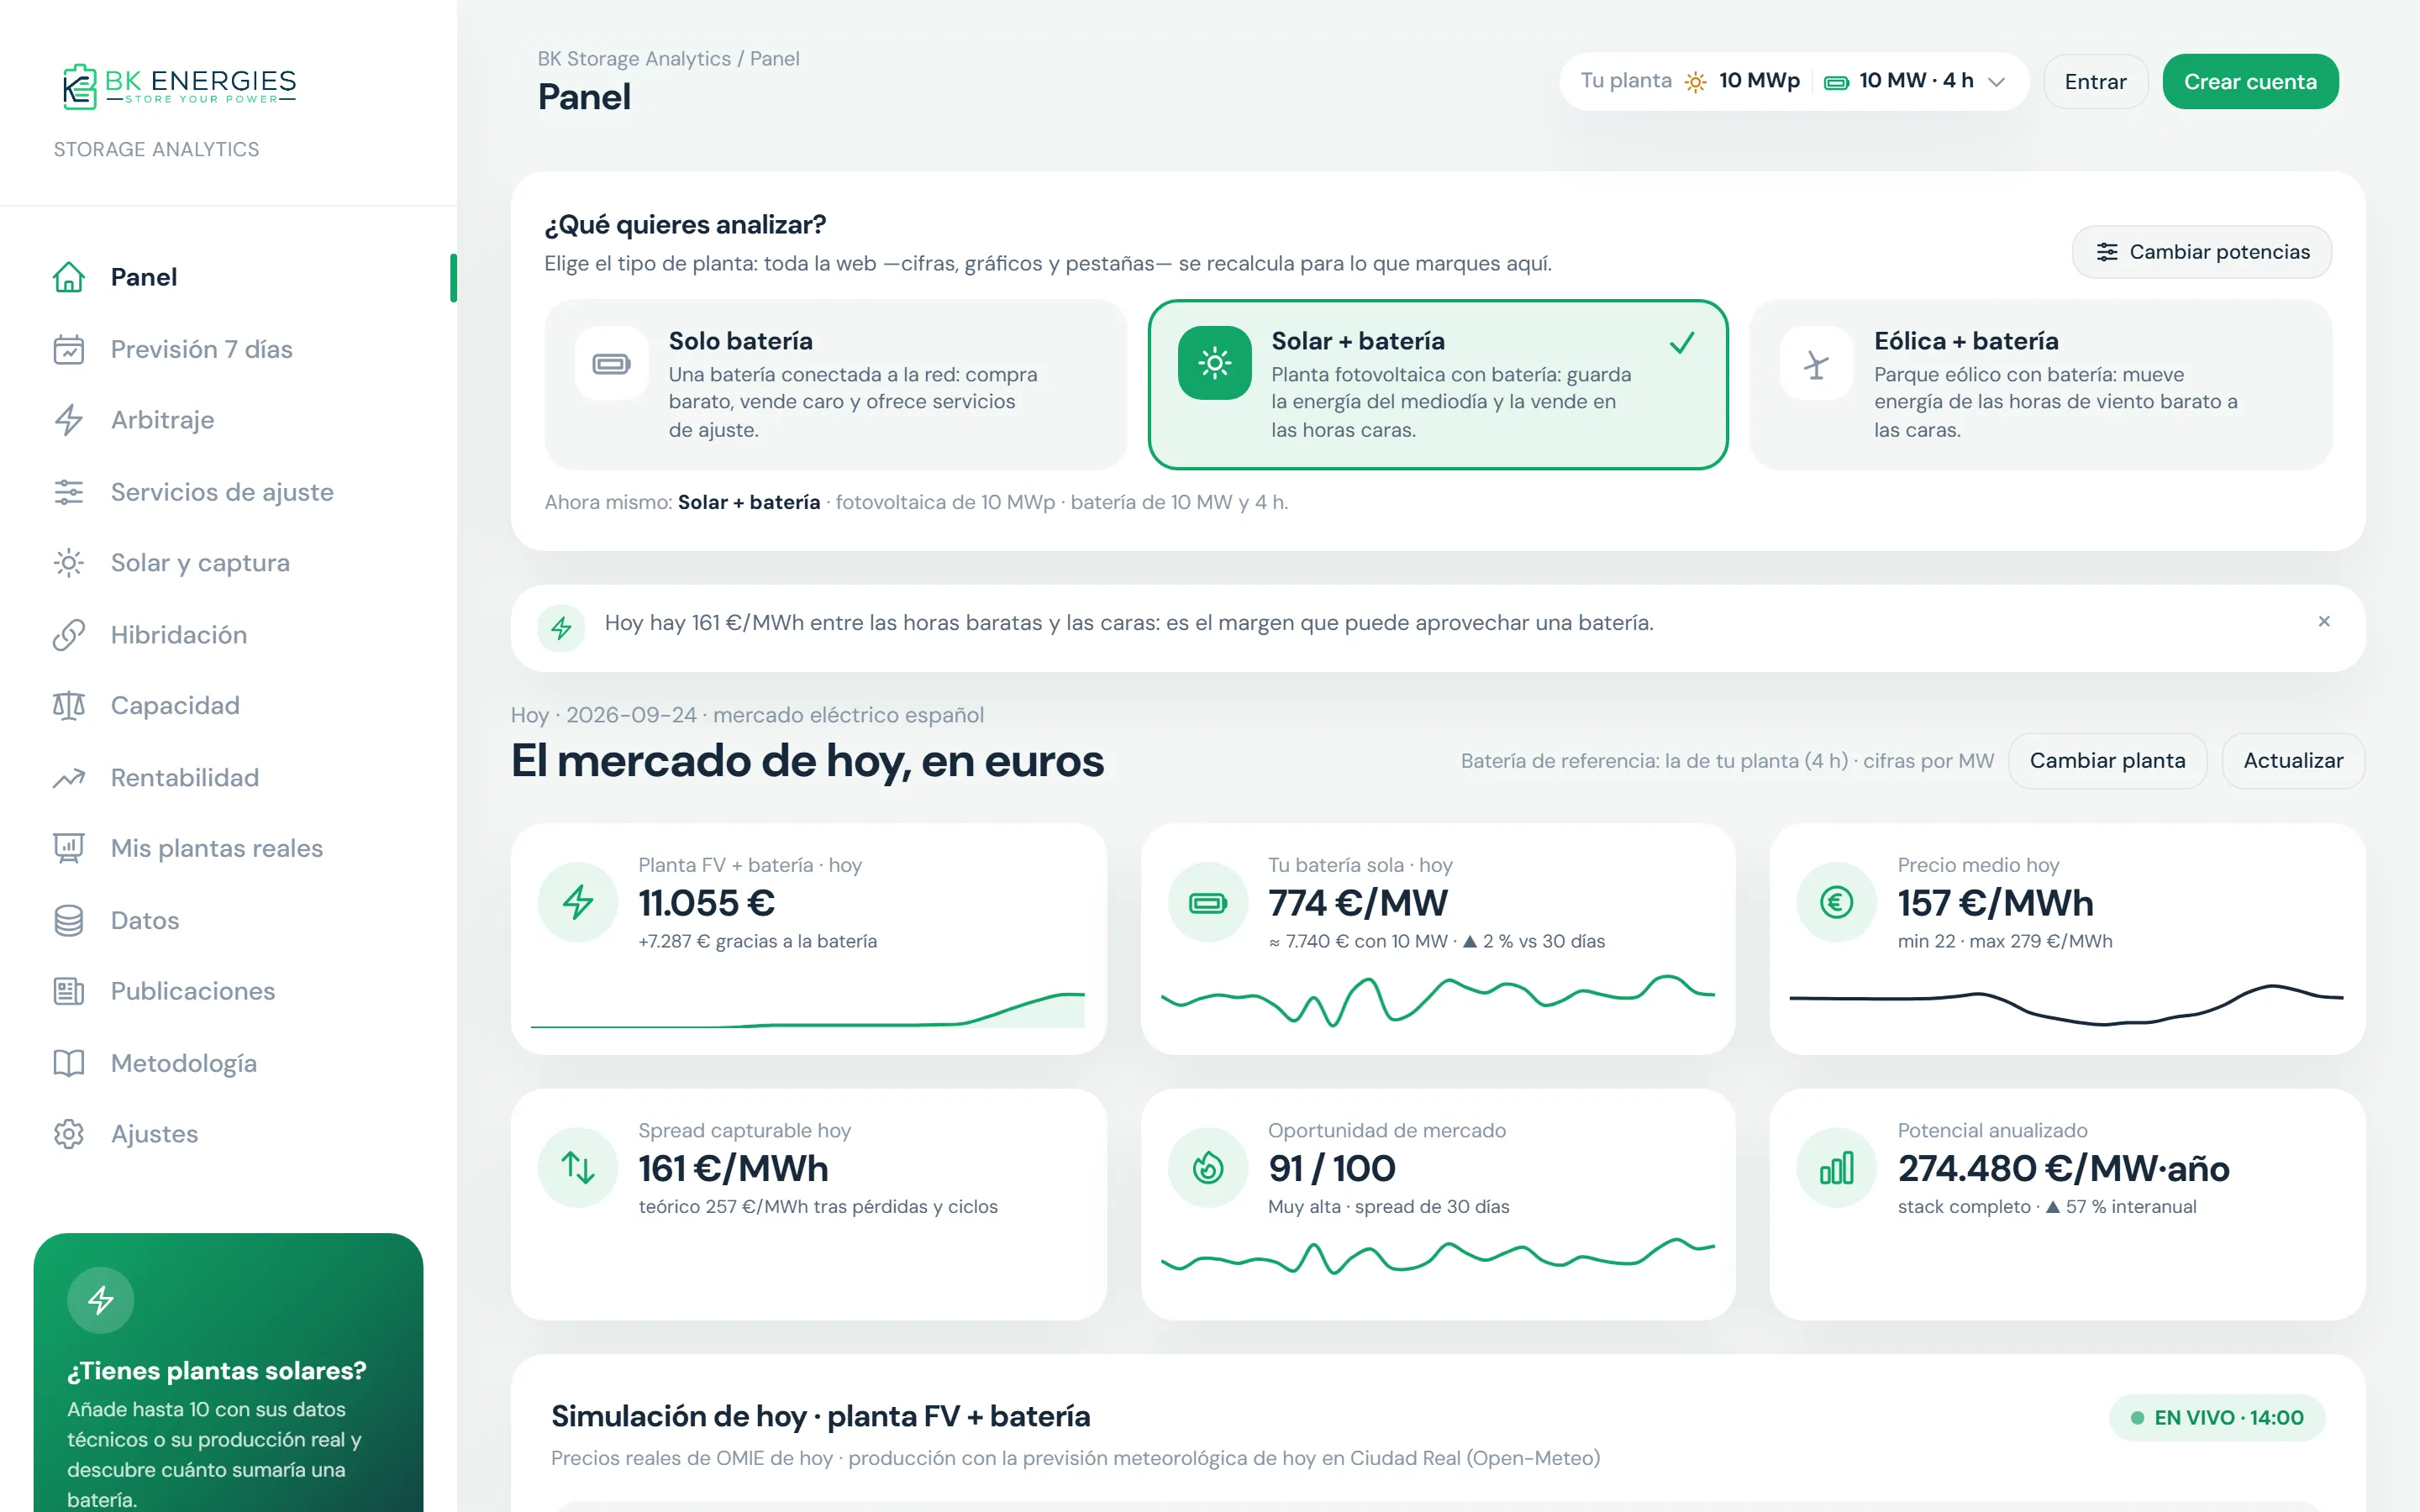
The starting point
It all starts with the gap between the cheap hour and the expensive one.
Storage Analytics calculates that spread every day using the price published by OMIE and converts it into euros per MW for batteries of different durations, standalone or alongside a solar plant.
- OMIE
- ESIOS · REE
- PVGIS
- Weather forecast
- Charge
- 13:00–15:00
- Discharge
- 20:00–22:00
- Capturable spread
- €232/MWh
What's included
From the arbitrage index to project IRR.
Each tab answers a specific question. Everything is recalculated with the plant type and battery you choose.
Arbitrage
Arbitrage index
What a 1, 2, 4 or 12-hour battery would have earned buying low and selling high, using OMIE's hourly price since 2014.
See it on the dashboardBalancing services
Capacity and balancing energy
How much secondary frequency control (aFRR) and the system operator's balancing services add to a battery's revenue.
See it on the dashboardSolar
Solar capture
The price a solar PV plant actually earns compared with the market average, and how far it drops in the midday hours.
See it on the dashboardHybridisation
PV + battery by province
Typical output in each province and how much a battery adds by shifting midday energy to the expensive hours.
See it on the dashboardProfitability
NPV, IRR and DSCR
Lifetime income statement in three scenarios, with project and equity IRR, debt service coverage and LCOS.
See it on the dashboardForecast
7-day price
Hour-by-hour price for next week with its error margin, zero or negative-price hours and expected spread.
See it on the dashboardWhat it looks like
Numbers you can take to the bank.
Low, central and high scenarios with the metrics investors and lenders ask for, and a weekly forecast that shows how far off it is.
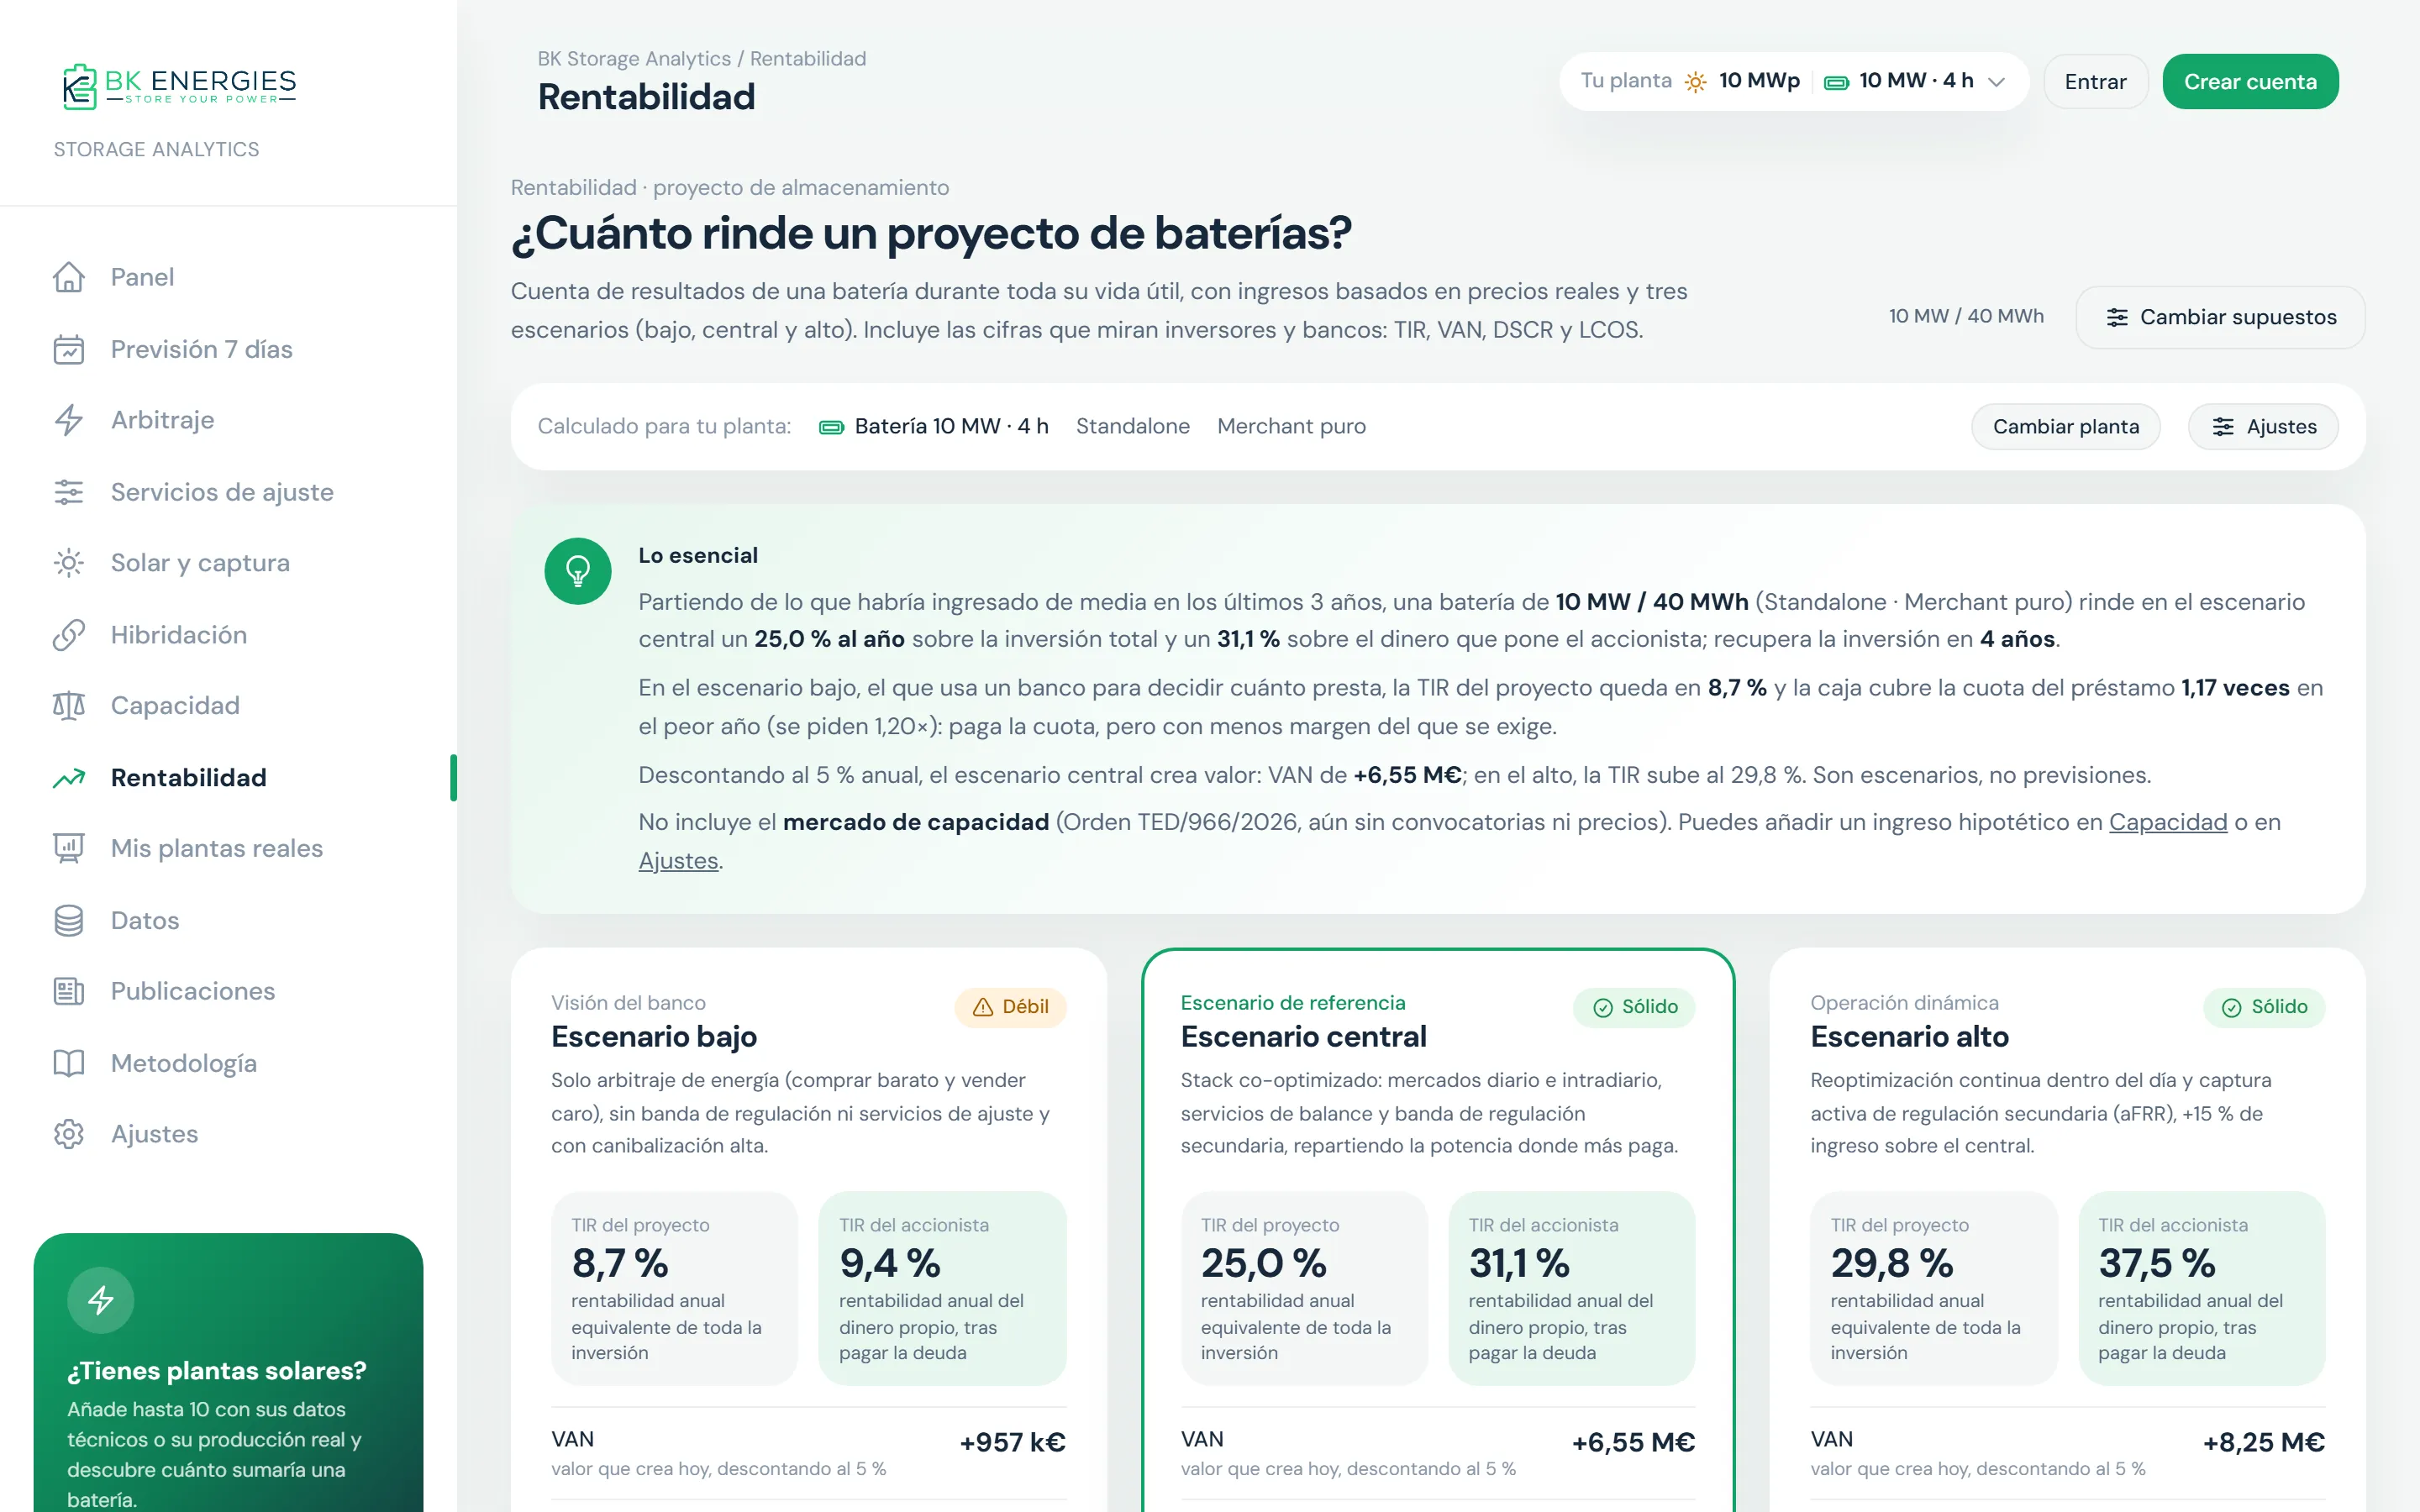
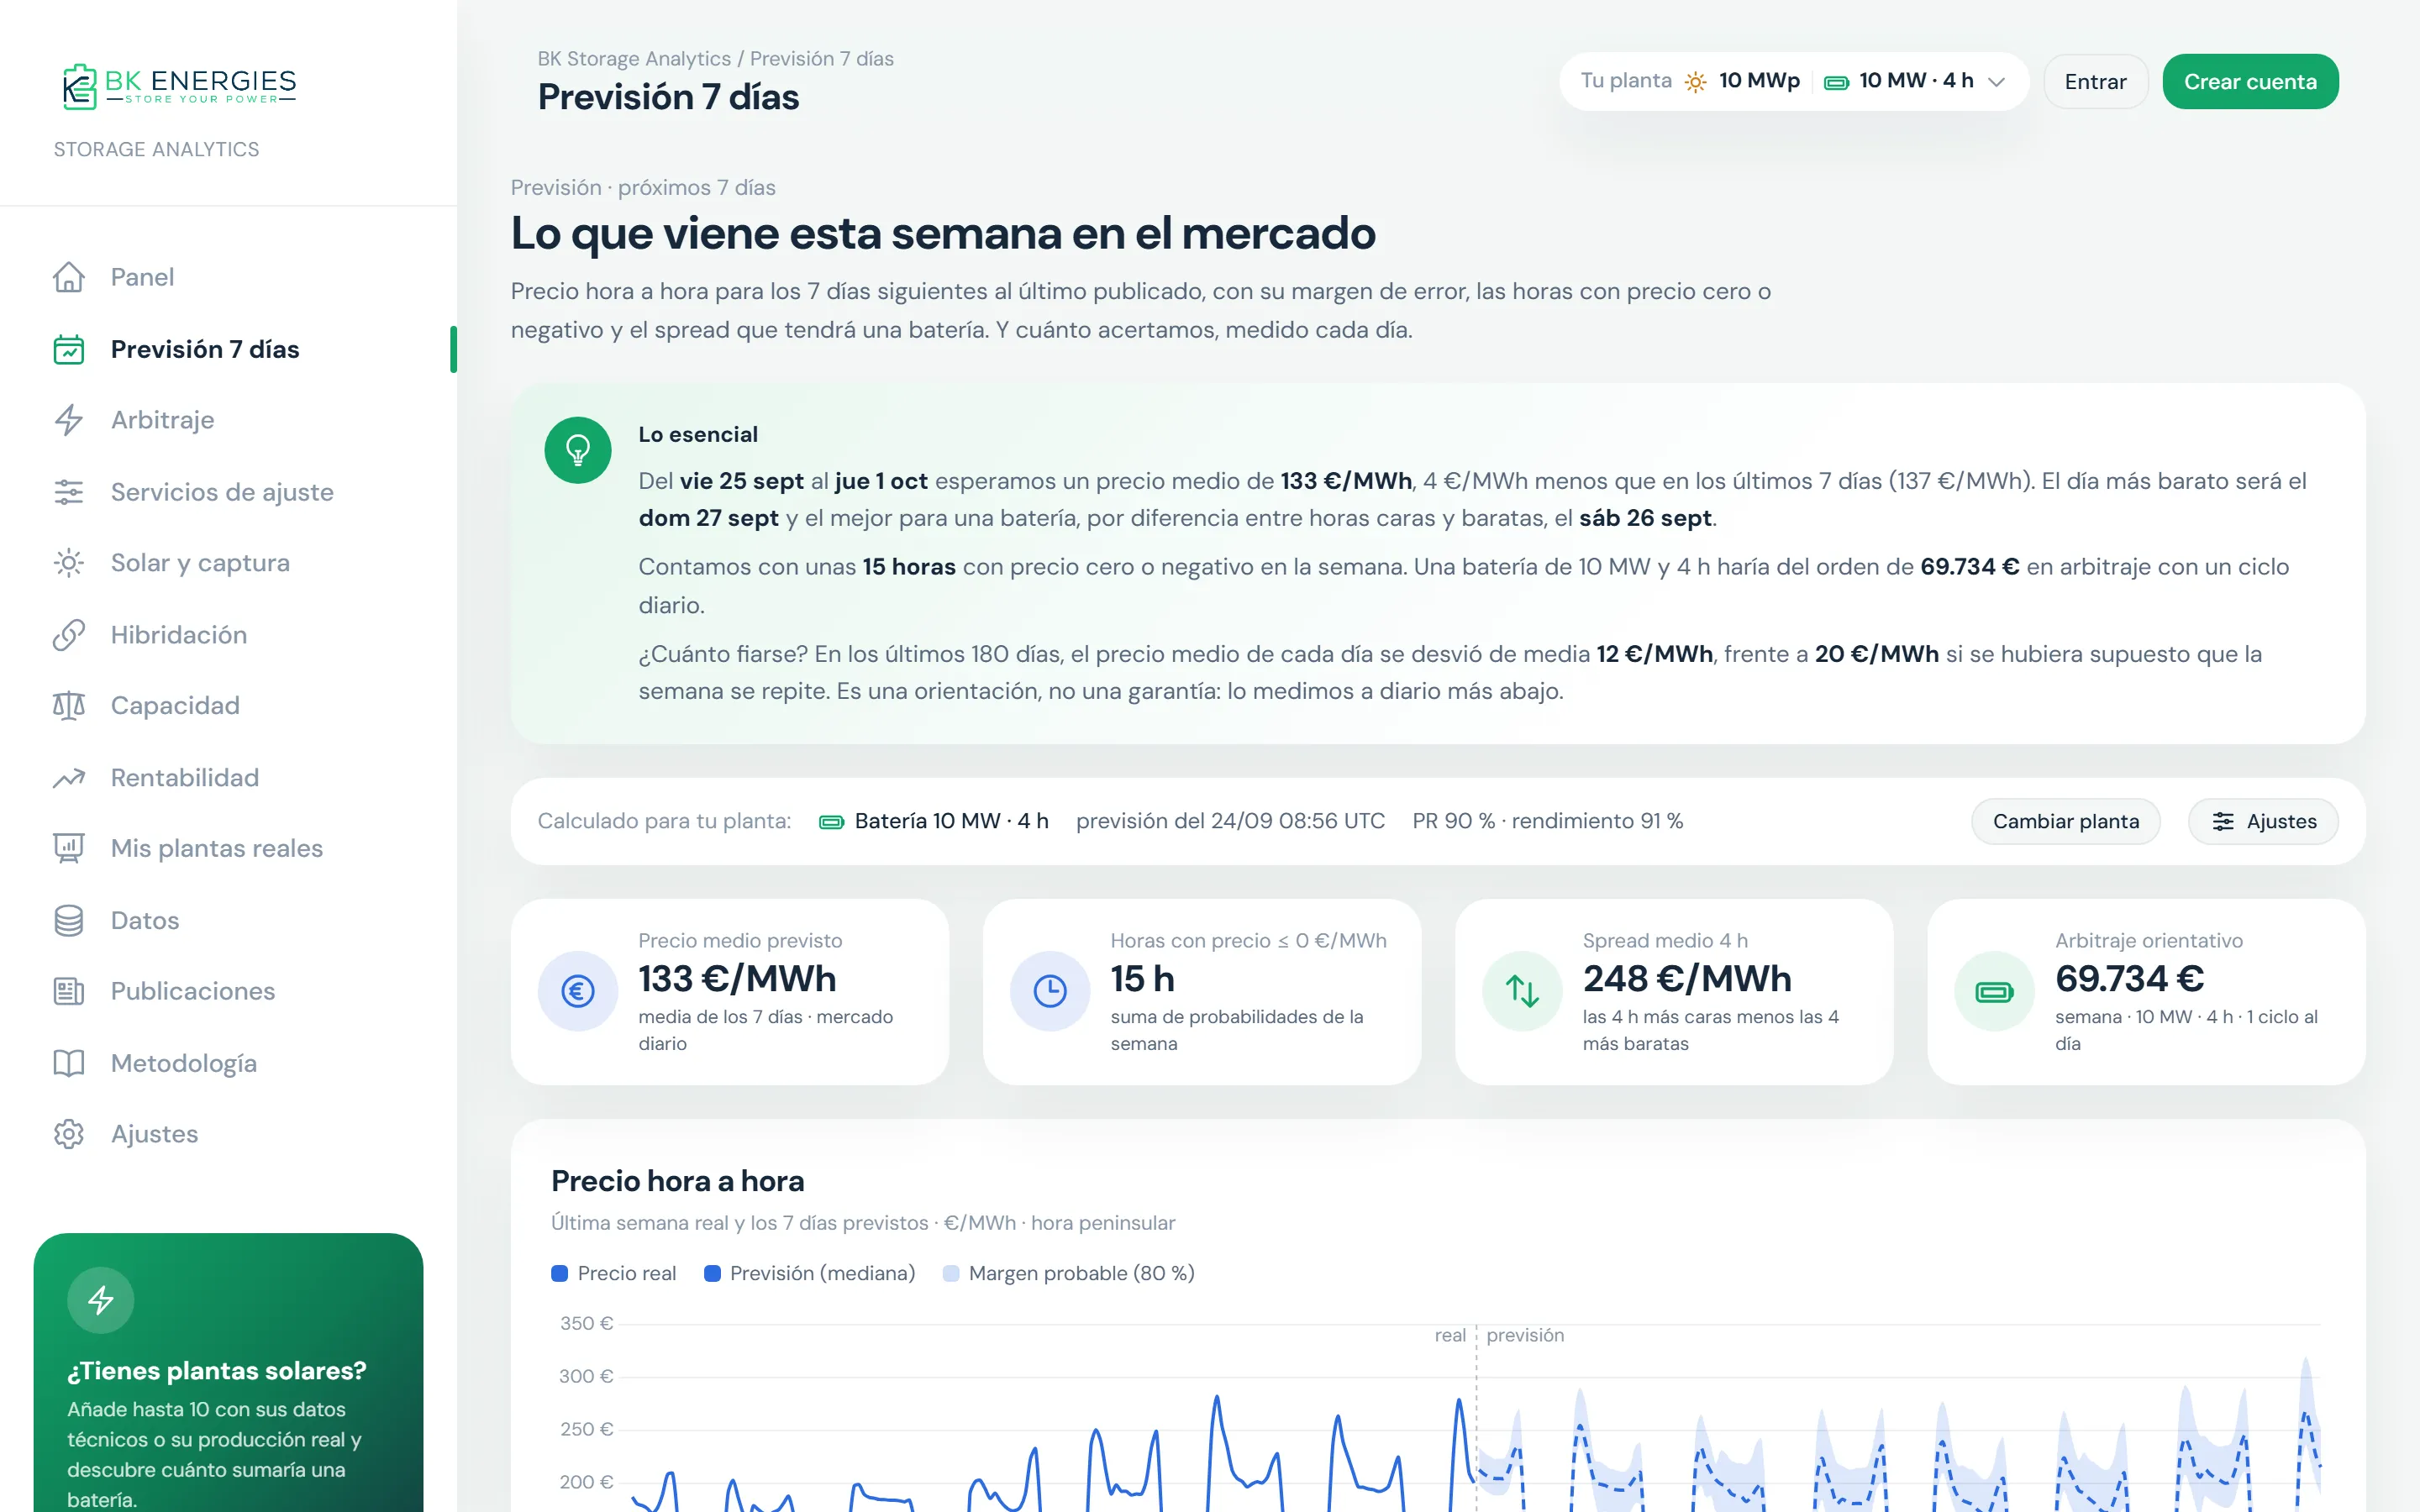
The figures in the screenshots change daily with the market. They are scenarios calculated from public data, not an offer or a revenue guarantee.
Open and free
Enter your plant and see what a battery would do.
Choose battery only, solar + battery or wind + battery, adjust the power ratings and the whole dashboard recalculates. No sign-up needed to browse.
Do the numbers add up? Let's do the real study.
Storage Analytics gives you the order of magnitude. Our engineers turn it into a project: site, grid connection, equipment, CAPEX and financial model.